Analytics
Your dashboards show the sales each experience brings in as they happen, credited through to checkout. Each month, we go through the numbers with you and agree what to improve next.
Analytics
Every experience reports the same way, so you can compare a configurator with a category page.
Switch the metric and hover over the chart: the same dashboard your team opens every morning.
Illustrative numbers in the shape of a real admin console dashboard.

A/B tests on demand
Split the traffic from the admin console, by share, cookie or link, and read the result in the same dashboard.

Your GA4 too
Every event can also be sent to your GTM or GA4 data layer, so your own reports agree with ours.

Attributed to the experience
Products the experience put in the basket are tagged through to the order, so the uplift is the experience's, not the page's.

Seen, not loaded
Views only count when the experience was actually on screen. Bots and headless browsers are removed.

Private by design
Events use a short-lived session id, never a user id, so no personal data is stored.
Case study
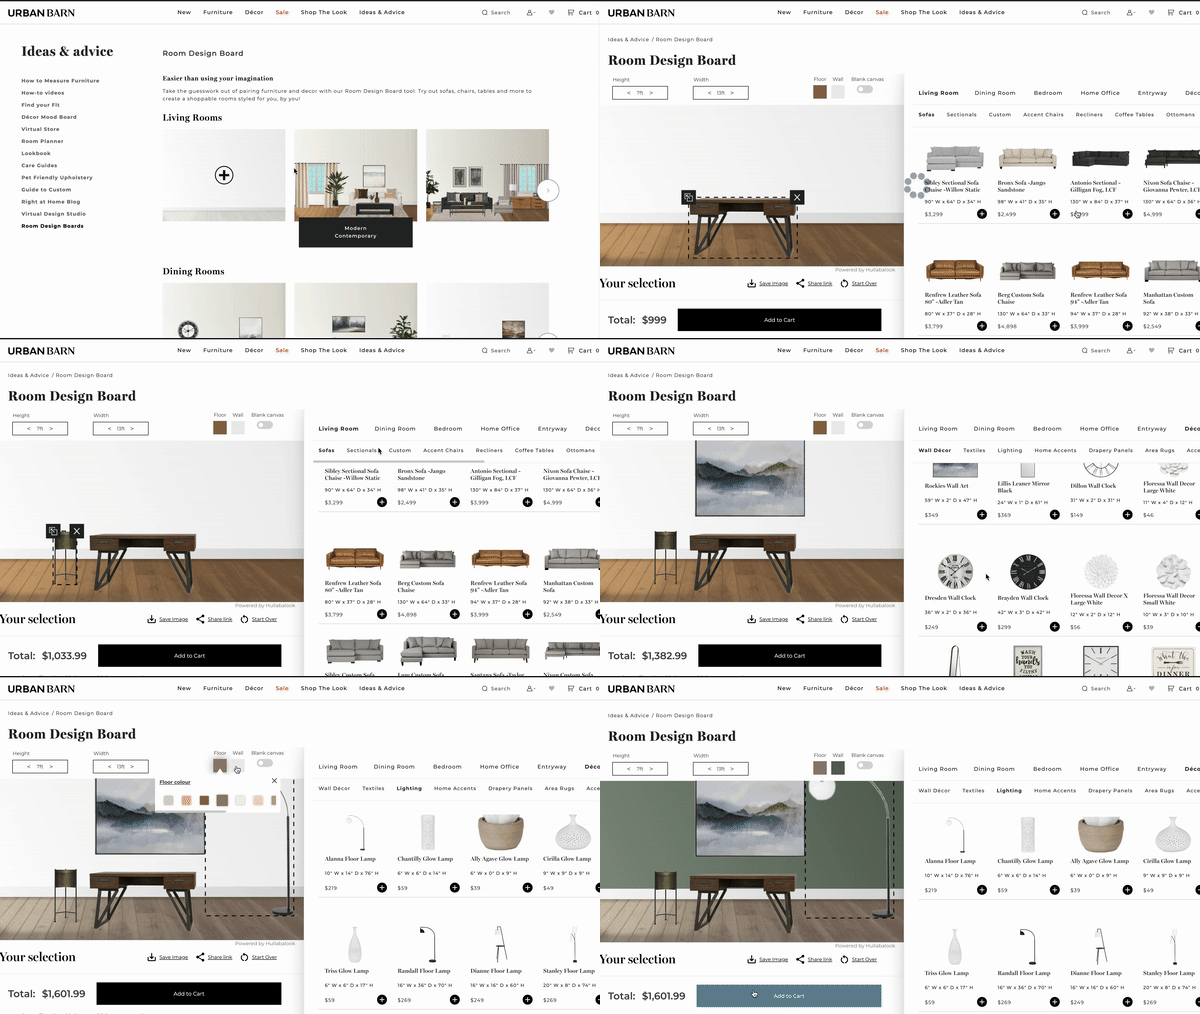
Urban Barn: shoppers using Room Creator converted 50% more (March 2021)
“Their technology continues to drive great ROI for Urban Barn. We are very proud to be one of their longest standing customers.”Sasha Becker, Ecommerce Manager, Urban Barn
How it works
The sales
Sales and order value from each experience, by department.
The uplift
What the experience added, against our goal.
The insights
What shoppers built, swapped and saved, and what the choices show about your catalogue.
What is next
Fixes, releases and the next experiment, agreed on the call.
Want to see a real monthly report?
We will show you one, with the numbers blurred.
Book a demo →